Reading the docs…
Stopped.
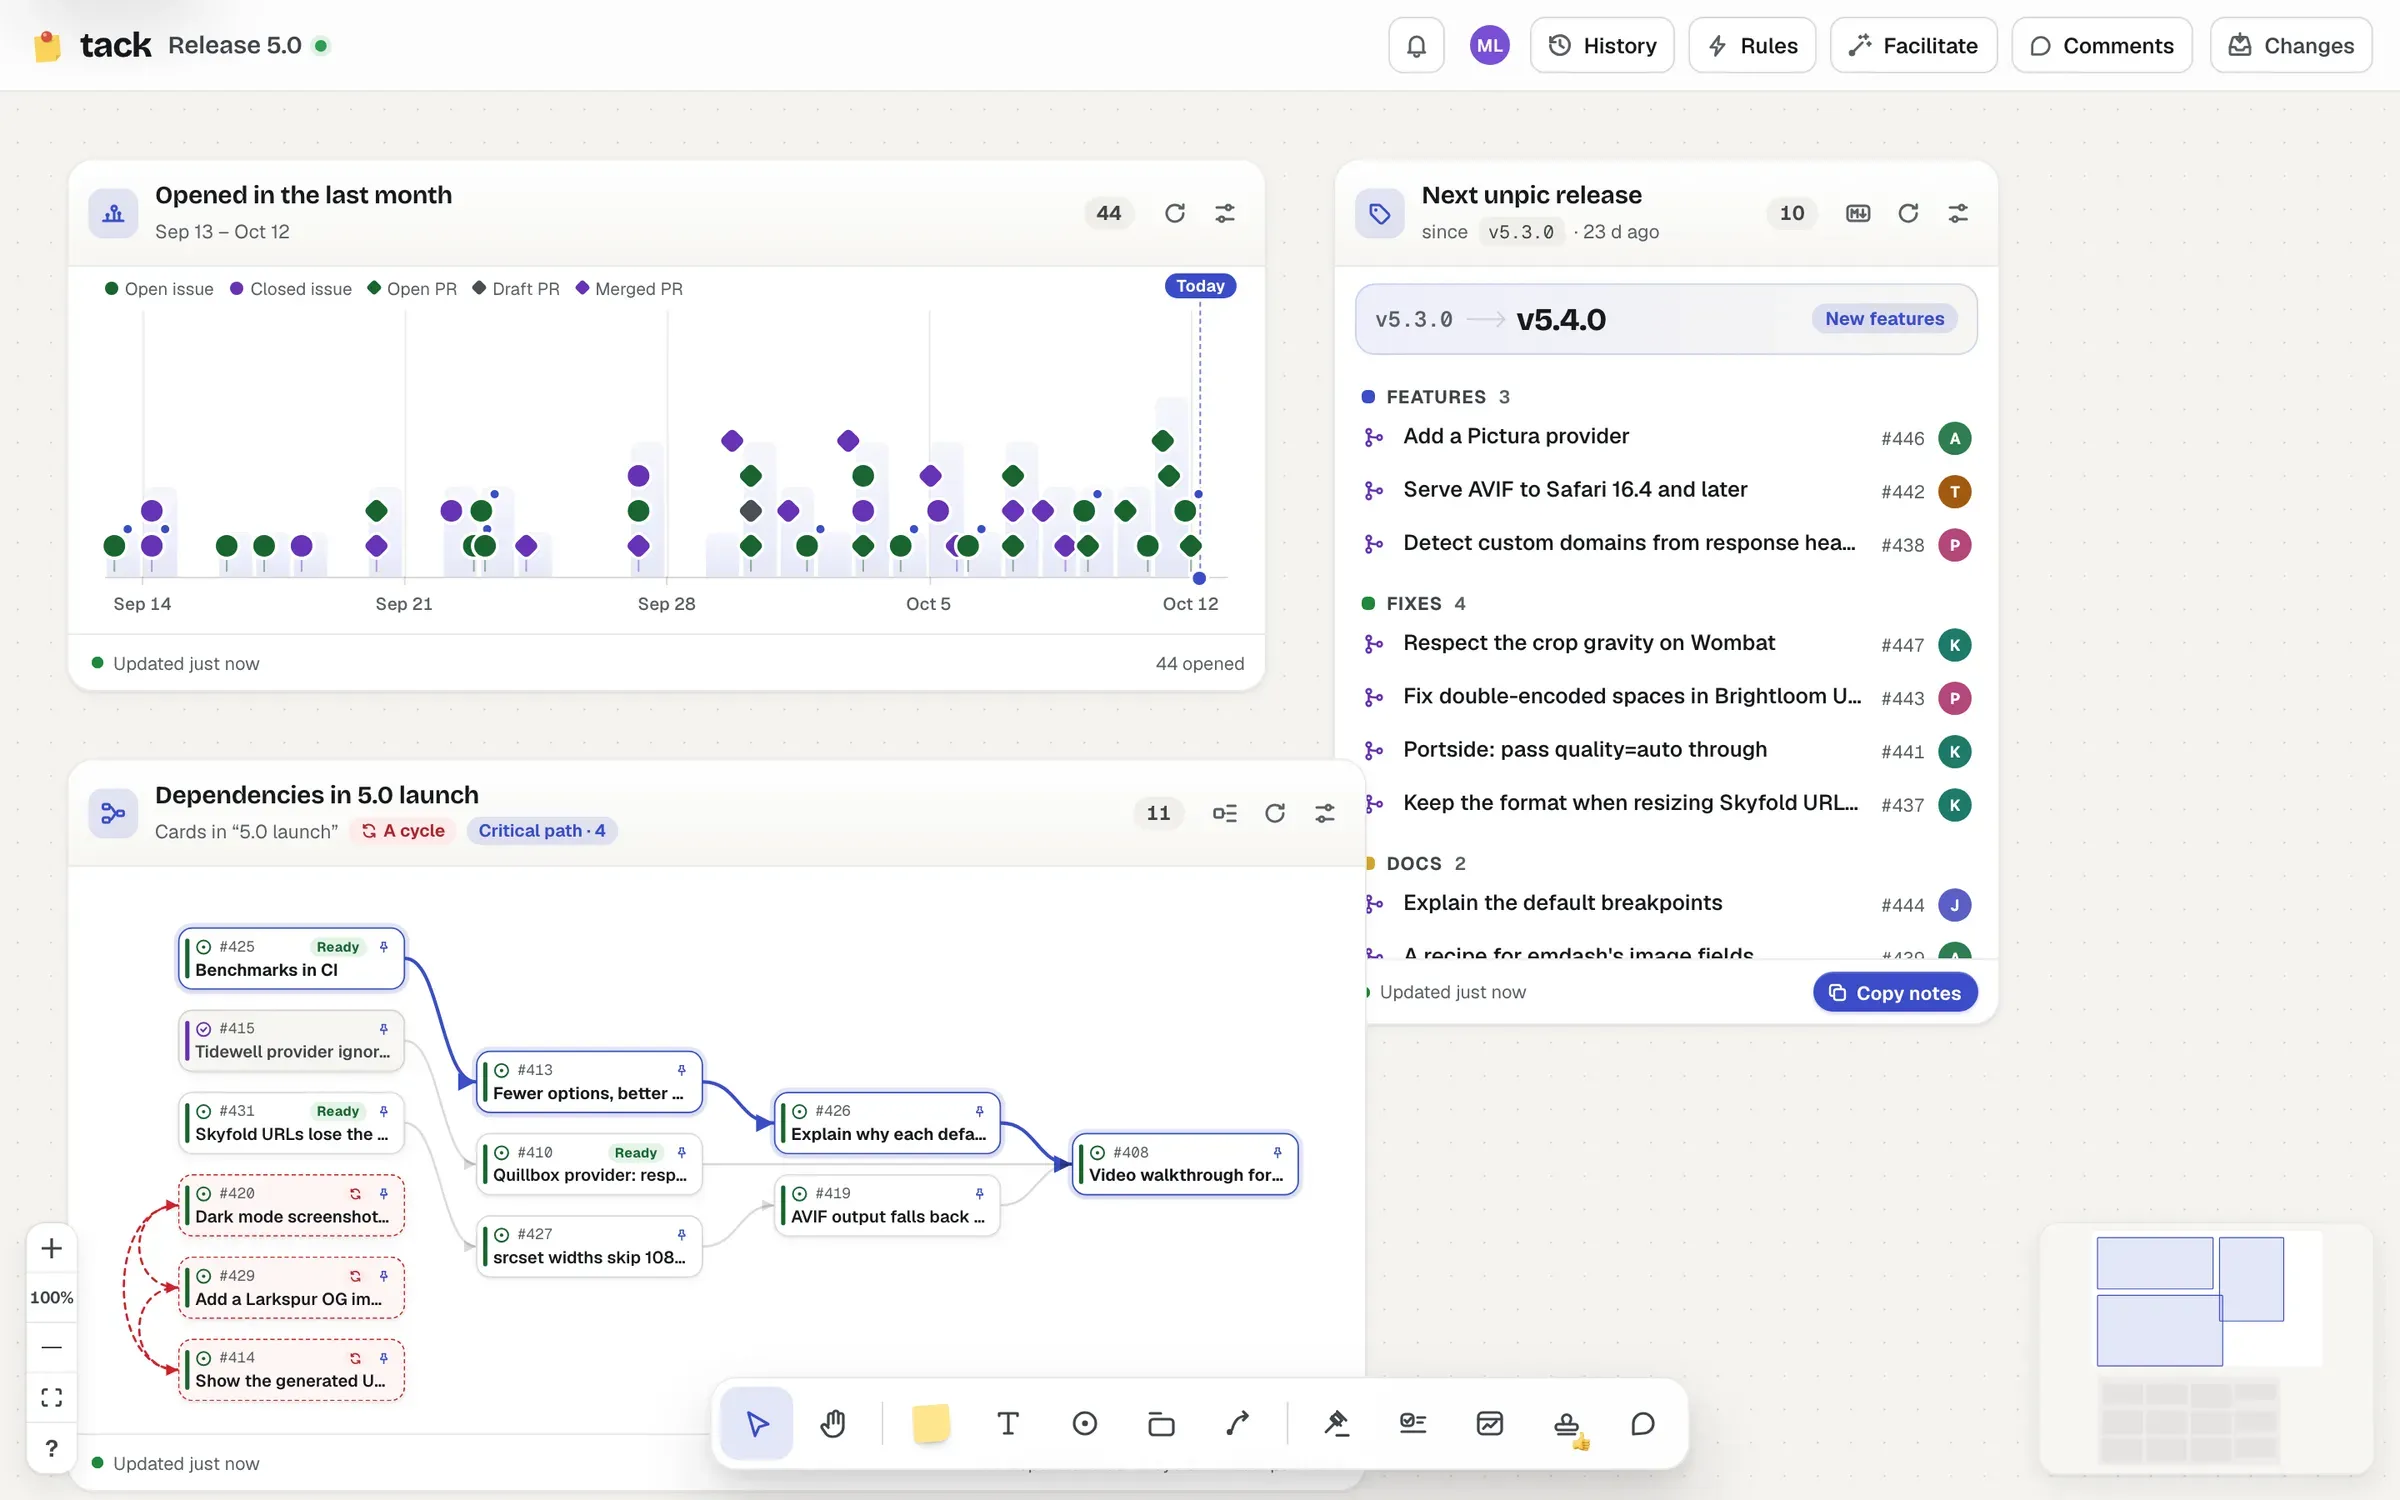
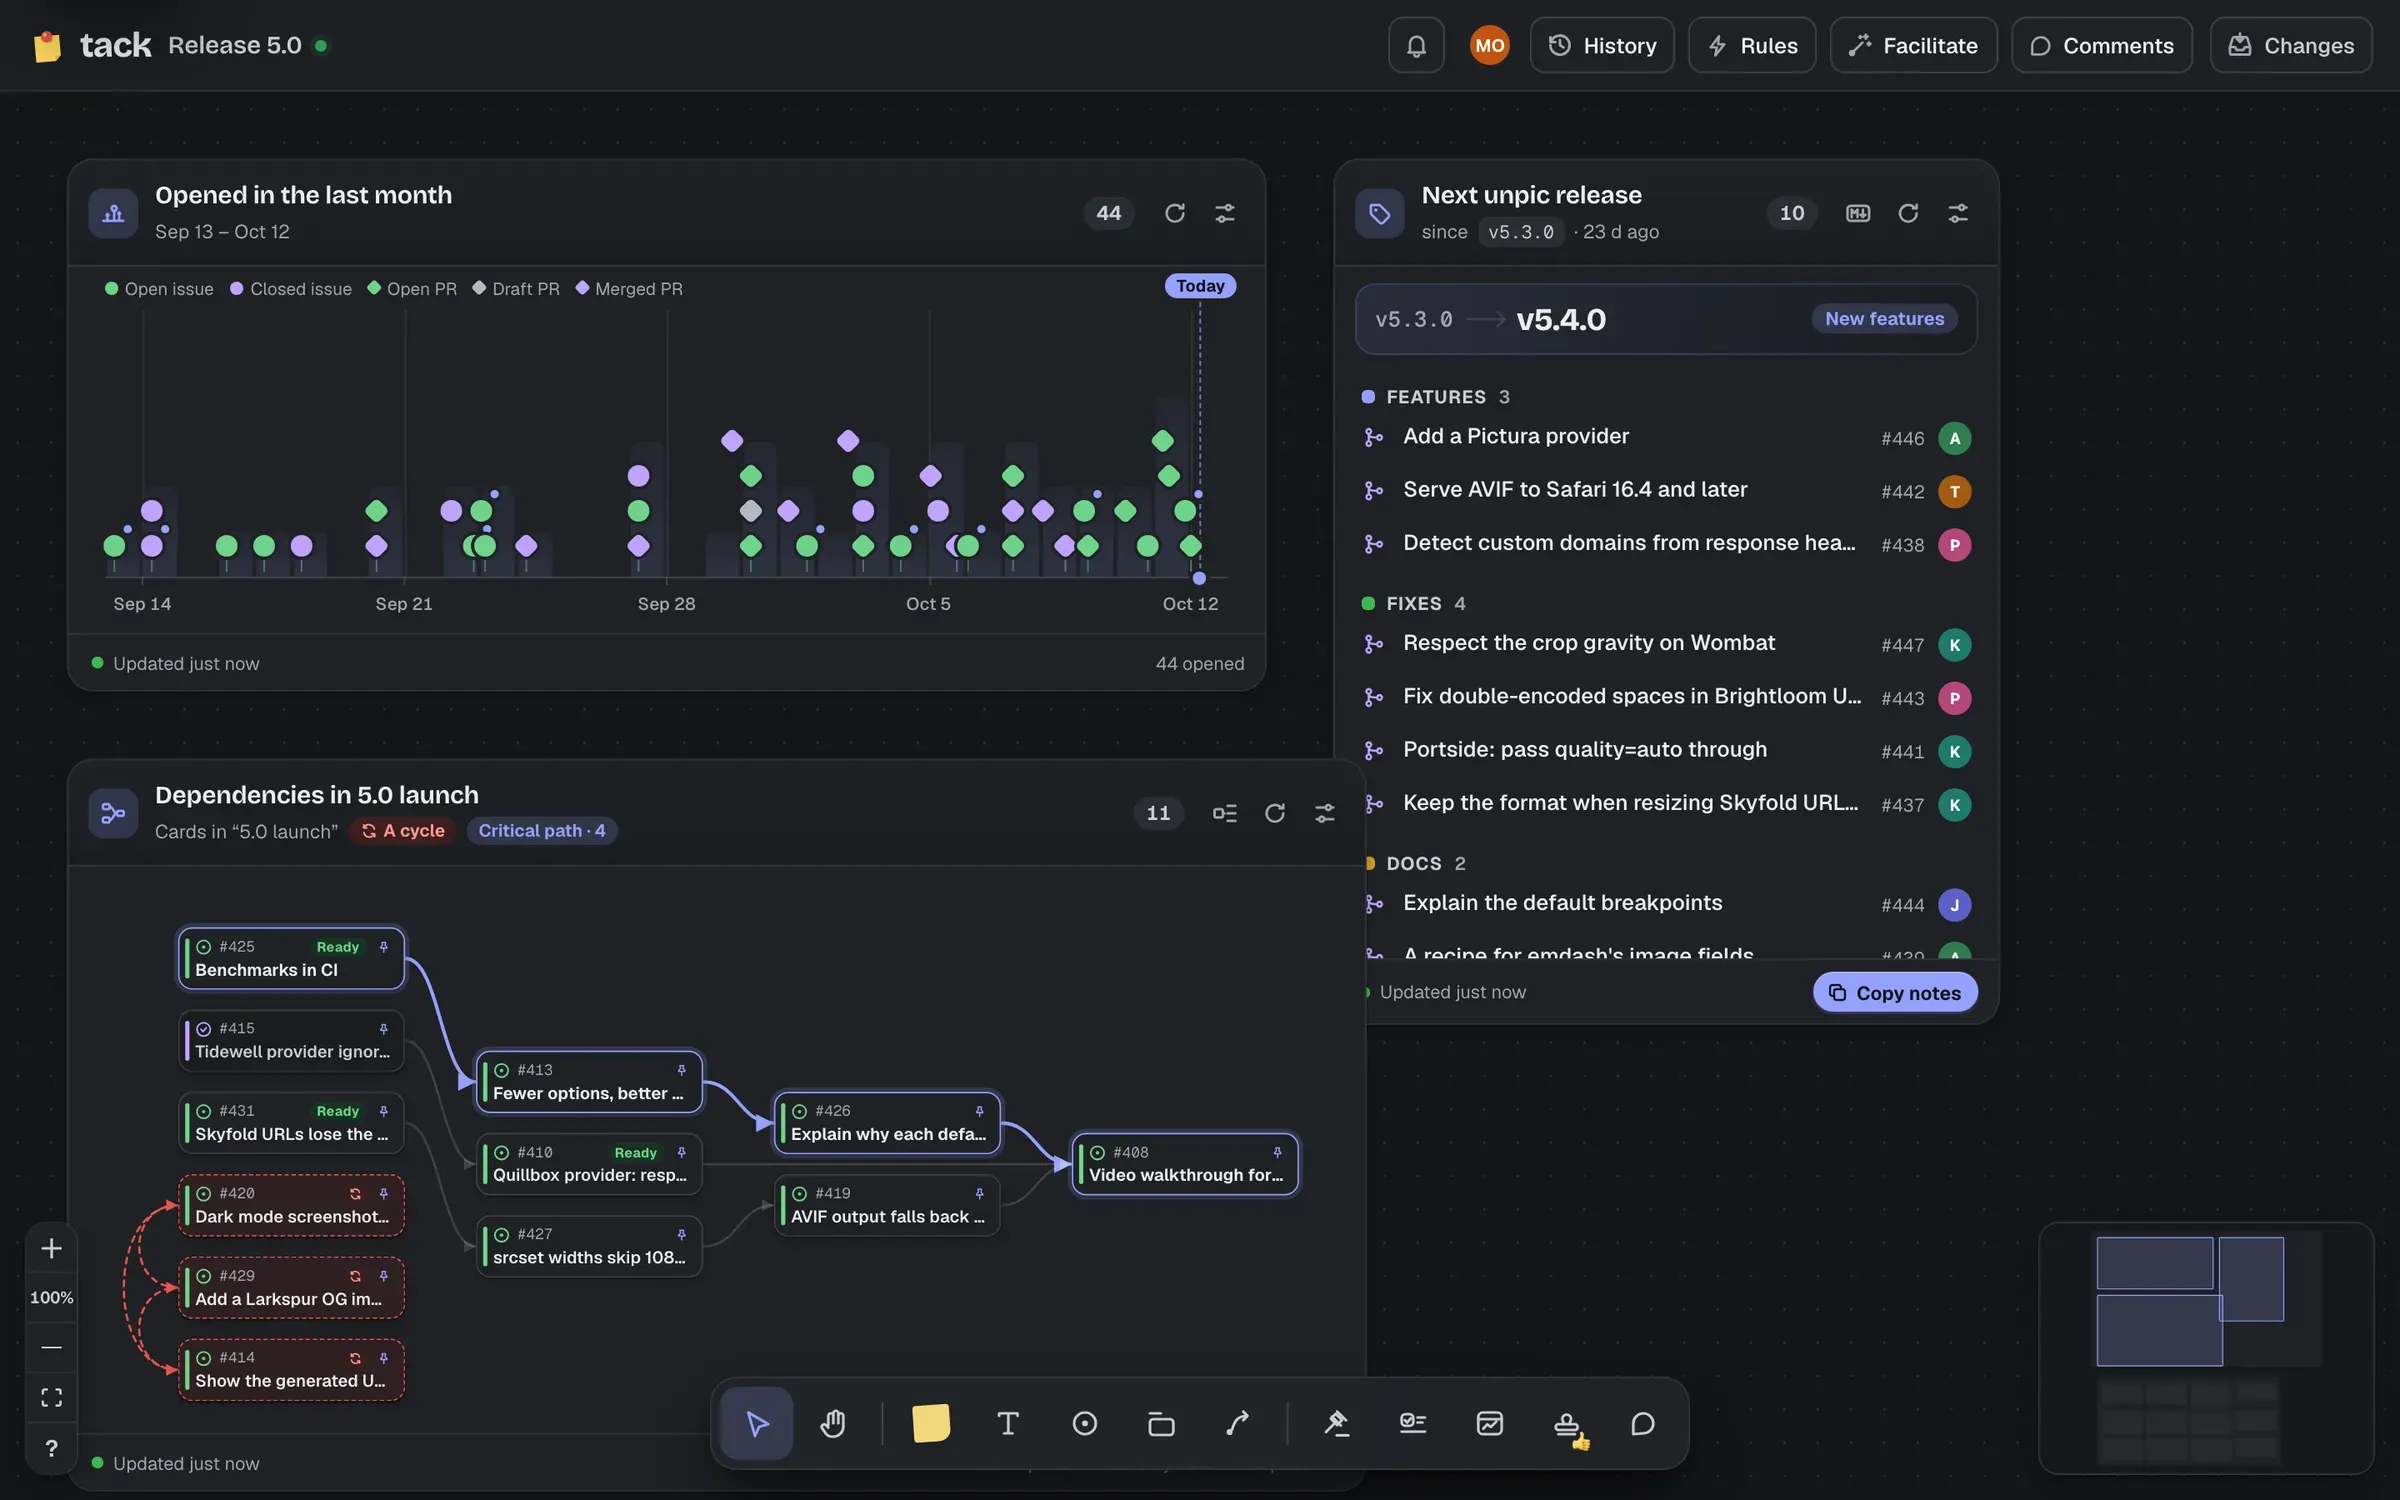
A timeline plots items along a line, by when they were opened, closed, merged or updated.
| Setting | Stored as | Accepts | Default |
|---|---|---|---|
| Title (named after what it shows if empty) | title | Text, at most 120 | empty |
| Forge (only shown when the board has more than one) | host | Text, at least 1 character and at most 253 | github.com |
| What to follow | q | Text, at most 400 | empty |
| Plot when they were: Opened, Closed, Merged or Updated | event | One of created, closed, merged, updated | created |
| Over: Week, 2 weeks, Month, 3 months or Dates | range | One of 1w, 2w, 1m, 3m, fixed | 2w |
| From (for Dates) | from | A date, YYYY-MM-DD, or empty | empty |
| To (for Dates) | to | A date, YYYY-MM-DD, or empty | empty |
| No control: stays at its default | limit | A whole number from 10 to 100 | 100 |
What to follow narrows the search, usually to a repository (repo:owner/name). Tack adds the dates itself: created:2026-09-27..2026-10-10 for opened items, and so on, plus is:pr when you plot merges. Relative ranges are whole days ending today, and move on each day.
Markers stack by day, with density bars along the axis and a line for today. Circles are issues and diamonds are pull requests, coloured by state; the key along the top lists the ones on the timeline (open issue, closed issue, open, draft, merged or closed pull request). Where too many land close together they cluster (“12 items: zoom in”); click a cluster to zoom in, and Show the whole range to zoom out.
Point at a marker to see the item. Click it to add its card in free space beside the timeline, or, if it’s already on the board, to find that card. ⌘-click (Ctrl-click) opens it on GitHub. Drag it out to add a card somewhere else.